
Open6GCore integrates tracing, logging and metrics across its components to provide end-to-end visibility into network behavior. Operators can monitor service and infrastructure metrics through custom Grafana dashboards and inspect distributed procedure traces in Jaeger, linking system-level trends to individual requests and interactions.
The observability stack supports both live operation and reproducible experimentation. Dashboards provide a consolidated view of key performance indicators and resource utilization, while traces and logs expose the sequence and context of events across distributed services. By correlating these signals, researchers can identify where delays or failures originate, follow their effects through the network and compare system behavior across configurations, workloads and experimental runs.
We illustrate how complementary observability views reveal different levels of system behavior: Grafana dashboards summarize metrics and trends, Jaeger traces reconstruct interactions across distributed components, and logs provide detailed event context for diagnosis and validation.
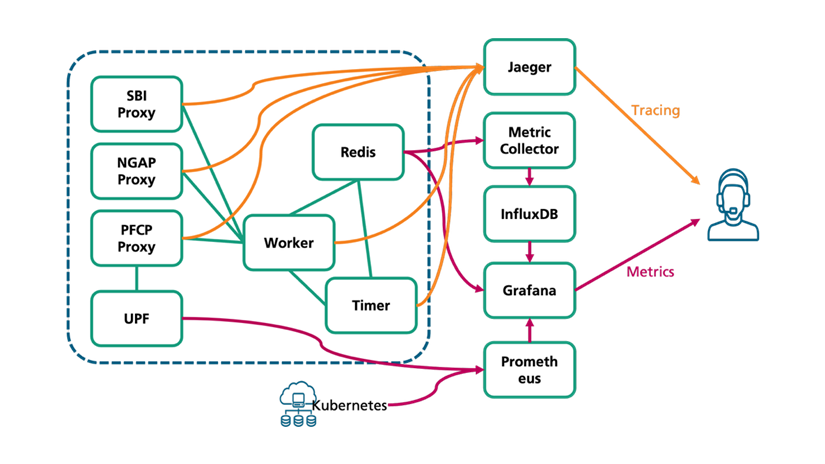
logs for end-to-end monitoring and experimental analysis. | © Fraunhofer FOKUS